In this guide we will review the installation and configuration of prometheus in order to obtain alerts via email using the federation, rules and alertmanager of prometheus in conjunction with the monitoring of Kasten K10.
Initial Steps
As usual, we will always review the official documentation of the solutions.ones that we will install and/or configure in this guide.
Prometheus: https://prometheus.io/
Kasten: https://docs.kasten.io/latest/operating/monitoring.html
We will carry out the configuration in a first part with the integration of K10 Multi-Cluster Manager and then we will see how to configure the rules when it is an installation without centralized administration.
What is Prometheus?
Prometheus is a solution focused on monitoring the resources of kubernetes based on time series metrics, that is, real-time monitoring of the actionsones that they are configured. For example with prometheus you could monitor, via rules, the use of CPU, Memory, Conexioneyes, sesionejust whatever you want to configure.
It is also the standard solution for monitoring clusters of kubernetes since it allows us to have a very detailed view of the resources to be monitored as well as helping us to solve any errors that exist.
Kasten K10 and Prometheus
Kasten also uses Prometheus for its internal monitoring of K10. In fact, in the previous link, we can see that there are many metrics that Kasten k10 export to Prometheus as for example:
- catalog
- jobs
- actions
- backup
- restore
- export
- import
- report
- run
So, how can we configure Prometheus to send us an email when, for example, some backup policy does not work correctly?
Prometheus setup on Kasten K10
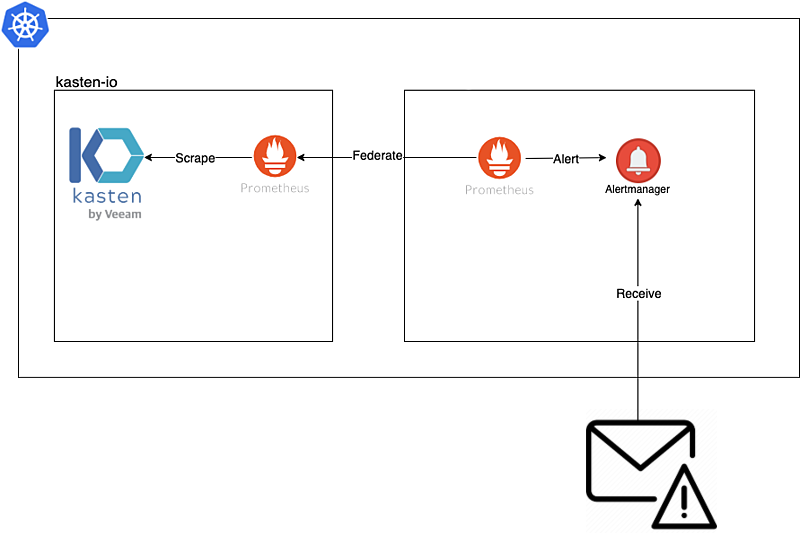
As we know, prometheus already comes pre-installed on Kasten K10, but for this instance it is not recommended that it be modified, since it is managed by helm and has certain settings.ones that work directly with the default reports of Kasten K10 and also for K10 Multi-Cluster Manager if you have it activated. Therefore the idea is to federate Prometheus that comes pre-installed (so as not to modify it) with a new instance of Prometheus:
Installation and Configuration Prometheus
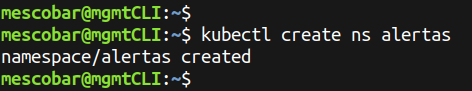
Now we will proceed to create a namespace for our monitoring instance, in this case we will call it alerts, for this we will execute the following in our cluster of kubernetes:
kubectl create ns alertas
And now we will add the repository for Prometheus helm:
helm repo add prometheus-community https://prometheus-community.github.io/helm-charts

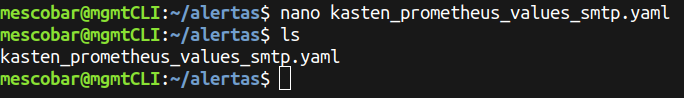
And we will create a new file named “kasten_prometheus_values_smtp.yaml”:
defaultRules:
  create: false
alertmanager:
  config:
    global:
      resolve_timeout: 5m
    route:
      repeat_interval: 30m
      receiver: 'email'
      routes:
      - receiver: 'email'
        match:
          severity: kasten
    receivers:
      - name: 'email'
        email_configs:
          - to: [email protected]
            from: [email protected]
            smarthost: smtp.24xsiempre.com:25
            auth_username: SuperDuperUserName
            auth_password: SuperDuperPassword
prometheus:
  prometheusSpec:
    additionalScrapeConfigs:
      - job_name: k10
        scrape_interval: 15s
        honor_labels: true
        scheme: http
        metrics_path: '/k10/prometheus/federate'
        params:
          'match[]':
            - '{__name__=~"jobs.*"}'
            - '{__name__=~"catalog.*"}'
        static_configs:
          - targets:
            - 'prometheus-server.kasten-io.svc.cluster.local'
            labels:
              app: "k10"
#Valores para deshabilitar componentes que no son necesarios
grafana:
  enabled: false
kubeApiServer:
  enabled: false
kubelet:
  enabled: false
kubeStateMetrics:
  enabled: false
kubeControllerManager:
  enabled: false
kubeEtcd:
  enabled: false
kubeProxy:
  enabled: false
coreDns:
  enabled: false
kubeScheduler:
  enabled: false
Where the following lines should be edited:
- to: [email protected]
- from: [email protected]
- smart host:smtp.24xsiempre.com:25
- auth_username: SuperDuperUserName
- auth_password: SuperDuperPassword
Modify the above variables with the correct data and save “kasten_prometheus_values_smtp.yaml”:
And now we install Prometheus with the following command:
helm install prometheus prometheus-community/kube-prometheus-stack -n alertas -f kasten_prometheus_values_smtp.yaml
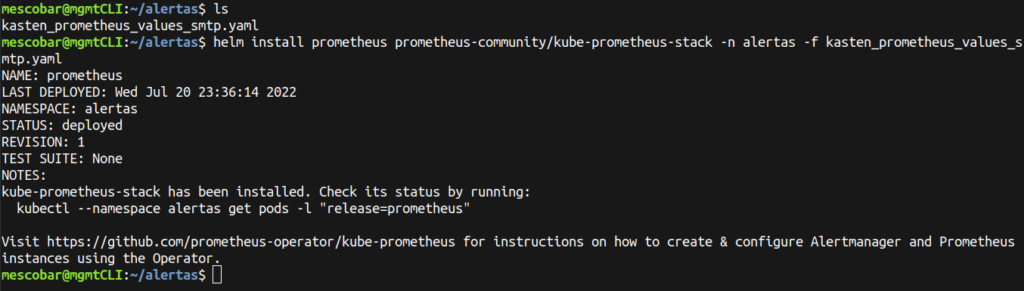
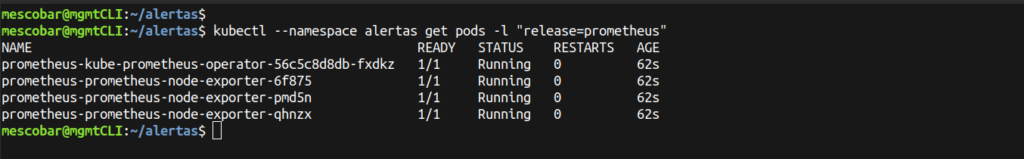
And to validate that it has been installed correctly, we execute:
kubectl --namespace alertas get pods -l "release=prometheus"
Creation of Prometheus Rules for K10 Multi Cluster Manager
Here we will make the most important configuration, since we are using K10 Multi-Cluster Manager, we must know how to correctly identify each of the clusters that is being protected by Kasten K10Therefore, when reading the documentation, a key “Tip” appears, where it indicates that to identify the secondary clusters, the variable {cluster=”development”} must be added, where the name of the cluster is how we identify it in Multi-Cluster Manager. And for the primary cluster it should be {cluster=””}.
For this guide, I have 3 clusters configured:
- production (primary cluster for K10 Multi-Cluster)
- development (secondary cluster for K10 Multi-Cluster)
- tanzu (secondary cluster for K10 Multi-Cluster)
Therefore, we will create the configuration file with the name “alertas_cluster.yaml” and copy the content:
apiVersion: monitoring.coreos.com/v1
kind: PrometheusRule
metadata:
  labels:
    app: kube-prometheus-stack
    release: prometheus
  name: prometheus-kube-prometheus-kasten.rules
spec:
  groups:
  - name: kasten_alert
    rules:
    - alert: K10JobsFailsClusterProd
      expr: |-
        increase(catalog_actions_count{cluster="", status="failed"}[10m]) > 0
      for: 1m
      labels:
        severity: kasten
      annotations:
        summary: "Politicas de Kasten K10 con error hace 10 minutos"
        description: "Politica << {{ $labels.policy }} >> en cluster << produccion >> Ha fallado en los ultimos 10 minutos"
    - alert: K10JobsFailsClusterDev
      expr: |-
        increase(catalog_actions_count{cluster="desarrollo", status="failed"}[10m]) > 0
      for: 1m
      labels:
        severity: kasten
      annotations:
        summary: "Politicas de Kasten K10 con error hace 10 minutos"
        description: "Politica << {{ $labels.policy }} >> en cluster << {{ $labels.cluster }} >> Ha fallado en los ultimos 10 minutos"
    - alert: K10JobsFailsClusterTanzu
      expr: |-
        increase(catalog_actions_count{cluster="tanzu", status="failed"}[10m]) > 0
      for: 1m
      labels:
        severity: kasten
      annotations:
        summary: "Politicas de Kasten K10 con error hace 10 minutos"
        description: "Politica << {{ $labels.policy }} >> en cluster << {{ $labels.cluster }} >> Ha fallado en los ultimos 10 minutos"
The variables to edit are in each of the alerts:
- alert: Name of the Alert
- expr: ONLY edit the cluster name (remember the previous tip)
- summary: Summary text without editing the variables
- description: Descriptive text
The most important variable in the above file is "expr" which is the "query" or query to prometheus according to the metrics of Kasten K10 To detect the failure in the jobs, if you want to create new queries you can visit:
https://prometheus.io/docs/prometheus/latest/querying/basics/
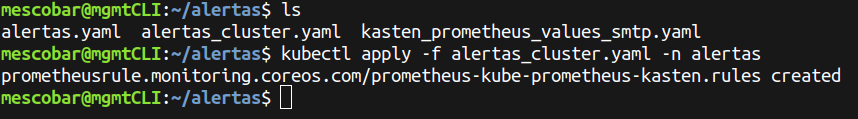
And finally we will create the rules in our Prometheus instance:
kubectl apply -f alertas_cluster.yaml -n alertas
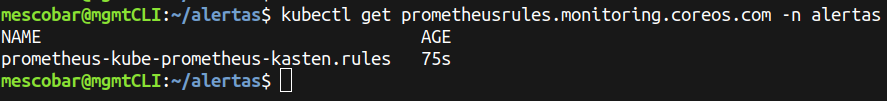
And to validate the creation of the rule:
kubectl get prometheusrules.monitoring.coreos.com -n alertas
Creation of Prometheus Rules without K10 multi-cluster
In case you have installed Kasten K10 without the use of K10 Multi-Cluster, also, it is possible to configure rules without the need to declare the name of the cluster, the only difference is the creation of the rule that must be like the following:
apiVersion: monitoring.coreos.com/v1
kind: PrometheusRule
metadata:
  labels:
    app: kube-prometheus-stack
    release: prometheus
  name: prometheus-kube-prometheus-kasten.rules
spec:
  groups:
  - name: kasten_alert
    rules:
    - alert: K10JobsFail
      expr: |-
        increase(catalog_actions_count{status="failed"}[10m]) > 0
      for: 1m
      labels:
        severity: kasten
      annotations:
        summary: "Politicas de Kasten K10 con error hace 10 minutos"
        description: "Politica << {{ $labels.policy }} Ha fallado en los ultimos 10 minutos"
Testing Email Alerts
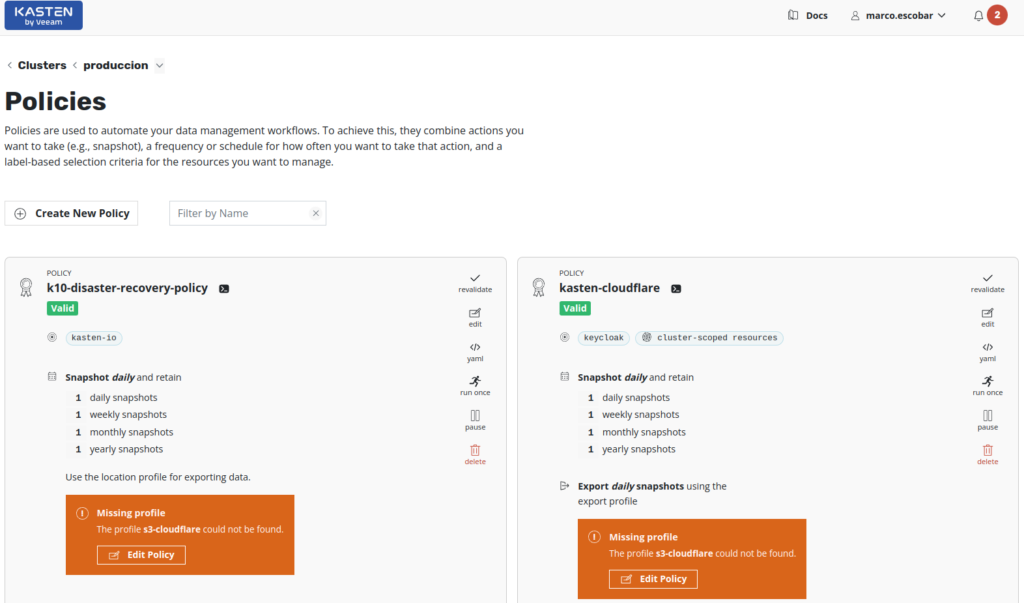
To test this configuration, we need to generate errors in the backup policies of the clusters, for that, in the existing backup policies we will eliminate the backup repositories of Kasten K10 o “Location Profiles” to force the error, where the policies will be shown like this:
And finally we execute the policies that generate the error. With this we should wait for the alerts to arrive by email. If we run the following command:
kubectl port-forward service/prometheus-kube-prometheus-prometheus 9090:9090 -n alertas
We can enter the Prometheus web console to see the created rules:
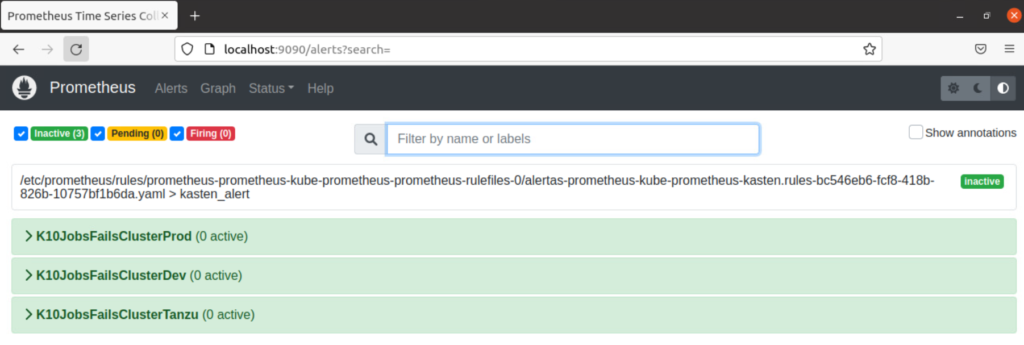
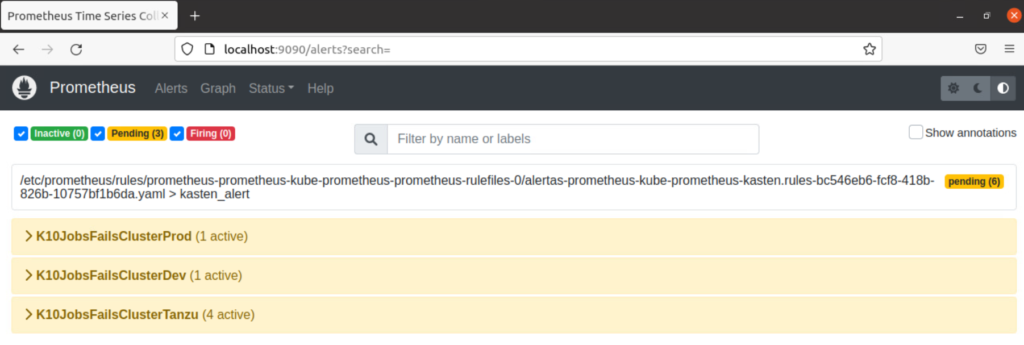
Running the backup policies with errors, prometheus, will detect through the rules that there are some errors:
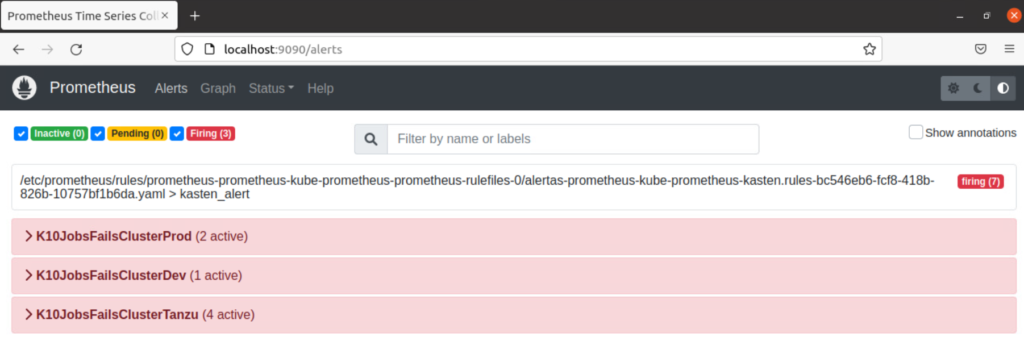
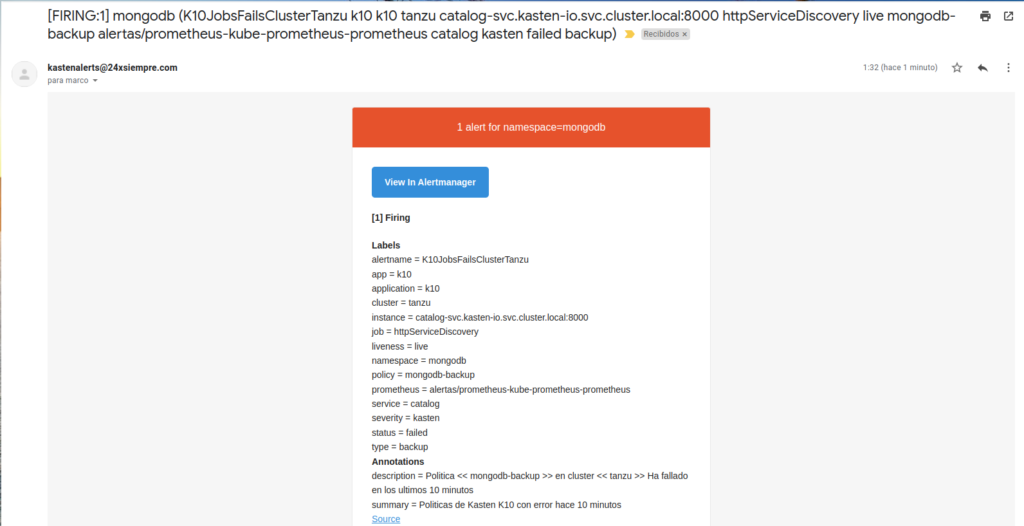
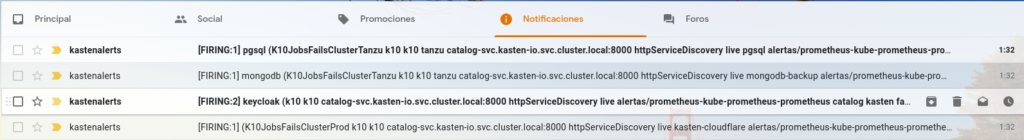
Where finally it marks it and the sending of the alerts by email is executed:
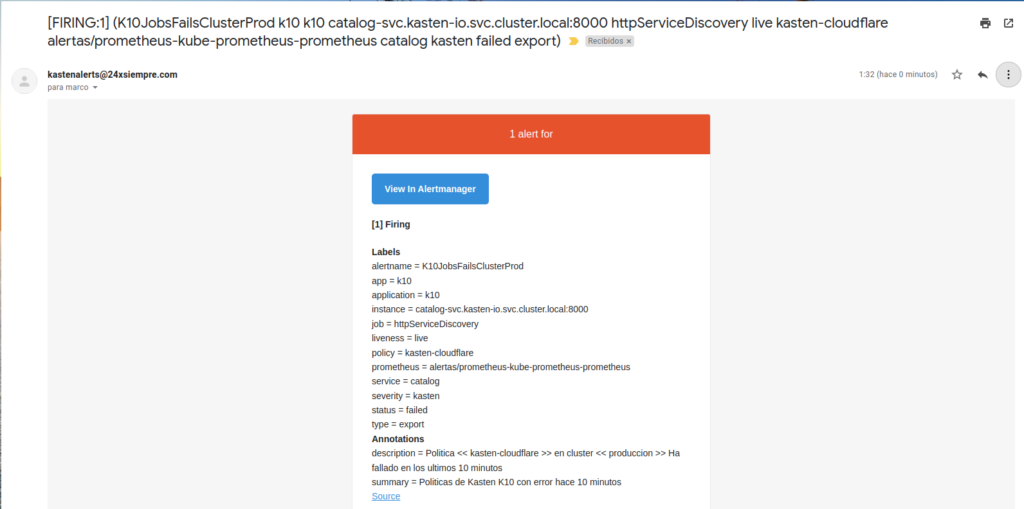
Some examples of notificationsoneso alerts that arrive in the mail, where it includes the name of the backup policy and its respective cluster where the error exists:
Recommendations
In some cases where instances of Prometheus already exist, it is possible, that adding the instance to monitor and federate prometheus from Kasten K10 didn't work correctly, for example in Rancher, with “cattle-monitoring” it is necessary to disable the prometheus operator, otherwise both instances will try to override with the other forcing the pods to restart.
Regarding the notificaciones or alerts of Kasten K10, it is possible to create new queries or queries to obtain other types of data, such as licenses, used space, etc.